PlatformFormsDocument IntelligenceCasesAnalytics
Store and reuse files across your workspace
Penbox now includes a dedicated file storage area under Console > Files. Upload documents, images, and assets once, then reference them wherever you need them: in forms, cases, or templates. The new workspace file picker shows authenticated image previews inline, so you see what you are selecting before you select it.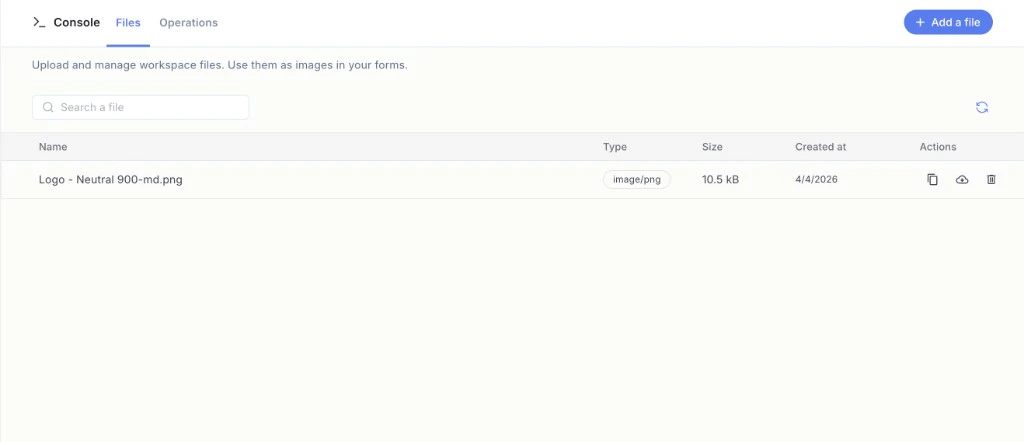
Improvements and fixes
- Forms. Italian and Portuguese are now available as form languages. The translation system has been rebuilt around a cleaner structure, making future language additions faster.
- Case inbox. Change status and “waiting for” directly from the datatable, without opening the full case view.
- Document Intelligence. Drag and drop to reorder fields in the template editor.
- Analytics. Filter reports by a specific form to see only the data that matters for that process.
- Cases. Cancelled cases now appear in the All tab, making them searchable without switching views.
Case Templates
Publish, version, and revert your case templates
Case templates now support versioning. Publish a template to lock its current configuration as an immutable snapshot, complete with a version number. Revert to any previous version if something needs to change back. Every case created from a template records which version it used.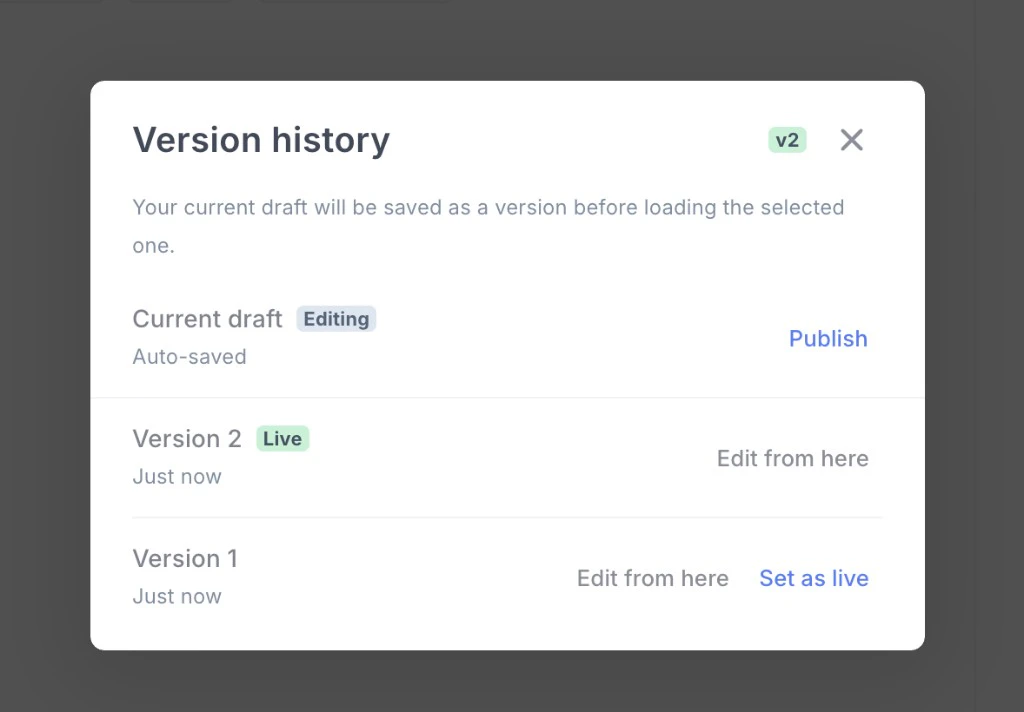
Publishing
When a template is ready, publish it. Penbox creates a numbered snapshot of the full template configuration: fields, structure, rules. The template stays editable for future changes, but the published version is frozen and available for use across the platform.Reverting
Roll back a template to any previously published version. The revert restores the full configuration from that snapshot. Useful when a change turns out to be wrong, or when a team needs to return to a known good state quickly.Version tracking on cases
Every case created from a published template records the version number it was built from. For templates without a published version, existing behavior is unchanged. No migration, no disruption.API
Integrations that create or update cases through the API automatically use the latest published version. No code changes required on the caller side.Docs →Document IntelligenceCONNECT API
Document Intelligence templates
Document Intelligence now has a template system. You can define reusable templates that combine data extraction rules and document validation rules in one place — then reference them from the API or directly inside a case, without redefining anything each time.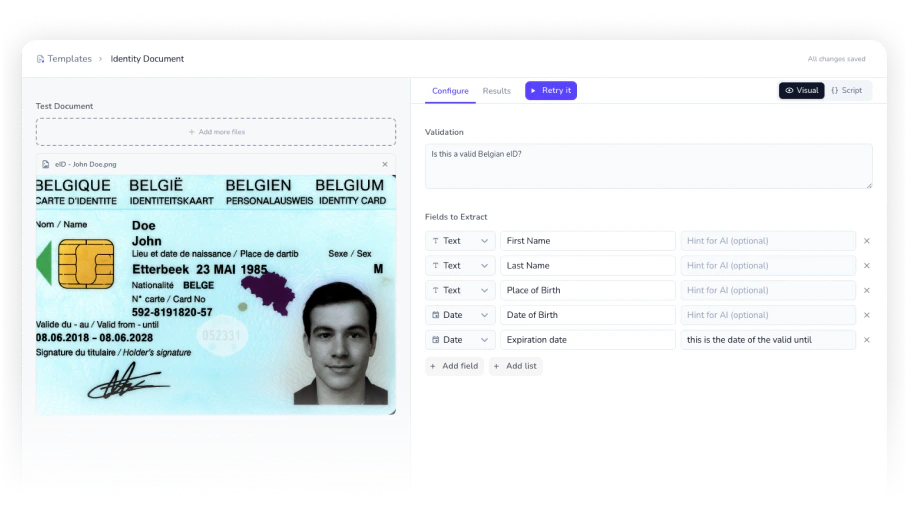
Template editor
The new visual template editor lets you build, test, and trust your document rules without writing any code. Define extraction fields and validation conditions, run them against real documents to see results instantly, then save the template. Once saved, you can copy its JSON for direct API use or reference it by ID anywhere in Penbox. For example, build a template for expense reports once — with required fields and validation rules — and reuse it across every integration and case flow that processes them.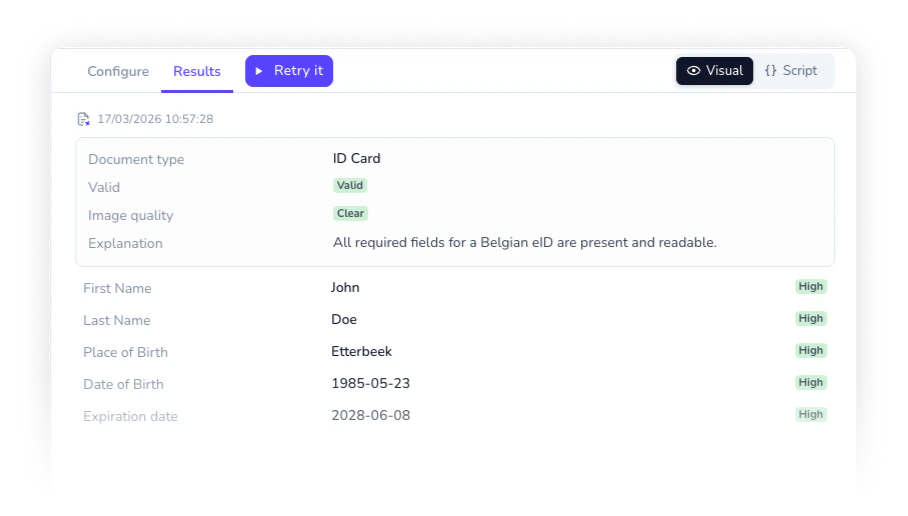
Templates in Connect
CONNECT’sPOST /document-intelligence endpoint now accepts a template reference, so integrations no longer need to send full rule definitions on every call. For example, pass a template ID instead of an inline configuration and let Penbox resolve the rules server-side — cleaner payloads, easier maintenance.Live results in cases
On any file element inside a case, you can now attach a Document Intelligence template, map its output fields to case data, and see the results appear live as soon as a document is uploaded. For example, attach a contract template to a file element, map extracted clauses and validation outcomes to case attributes, and have everything populated automatically the moment an agent uploads the document — no manual entry required.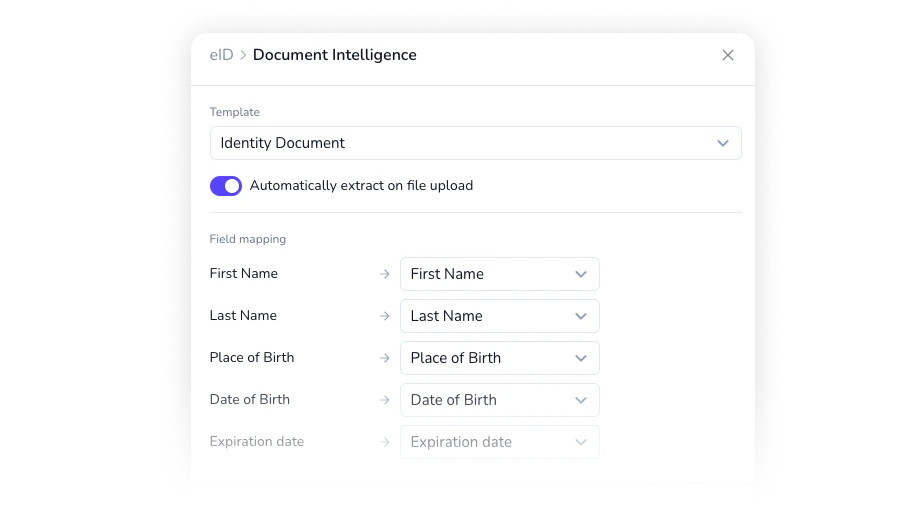
CasesFormsIntelligence
UX, forms, and intelligence improvements
A round of improvements across cases, forms, and document intelligence — from a new case status to smarter forms and real-time sync.Cancelled status for cases
Cases that are stopped but not resolved now have a dedicated Cancelled status, separate from Closed. Track cancelled cases in your analytics, filter them independently, and get a clearer picture of where work stops and why. For example, distinguish between cases closed after resolution and cases abandoned mid-process without mixing them in your reporting.Revamped Ask with Form
Ask with Form has been redesigned to be more precise and configurable. You can now define predefined values directly in the settings of a case or case template, giving your contacts guided options rather than open-ended fields. You can also toggle whether to include the existing value in the form sent — useful when you want contacts to confirm current information or start fresh. For example, pre-fill an address field with the value already on file and let the contact confirm or update it.Skip welcome page on forms
Smart Checklists now support a Skip Welcome Page option. Enable it on any form where you want contacts to land directly on the first question — no introductory screen, no friction. For example, use it for short, targeted data collection requests where the context is already clear from the email or message that accompanied the link.Whitelabel links for generic forms
Generic forms now fully support whitelabel domains. Copy the whitelabelled link directly from the app — no need to useflow.penbox.io anymore. For example, share a branded form link with contacts without any Penbox domain appearing in the URL.Improvements & fixes
- Email Intelligence. Improved document mapping accuracy and a cleaner UX for reviewing extraction results.
- Live case sync. Case pages now update in real time — every event is pushed live, and you can see when a teammate is viewing the same case alongside you.
- Performance. Multiple enhancements across the platform for faster load and smoother interactions.
Analytics
Analytics
Admins now have a dedicated Analytics page to monitor case performance, agent productivity, and form engagement across the workspace—filtered by date range, owner, or flow.Overview
The Overview tab gives you an at-a-glance summary of your workspace: active cases, closed cases, average resolution time, and average satisfaction rating. Two charts—daily case activity and case age distribution—let you spot trends and backlogs before they become problems. For example, use the daily case activity chart to identify spikes in incoming requests and correlate them with team capacity.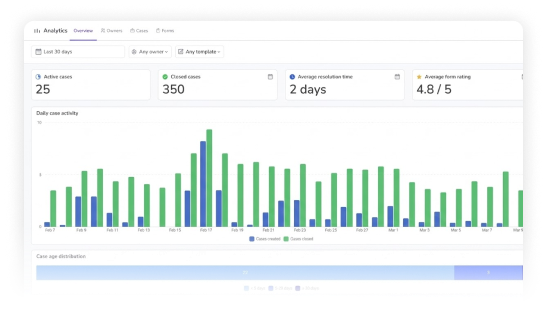
Cases
The Cases tab breaks down resolution performance by flow: average resolution time, median resolution time, and resolution rate per template. For example, pinpoint which flows consistently take the longest to close and prioritize process improvements there.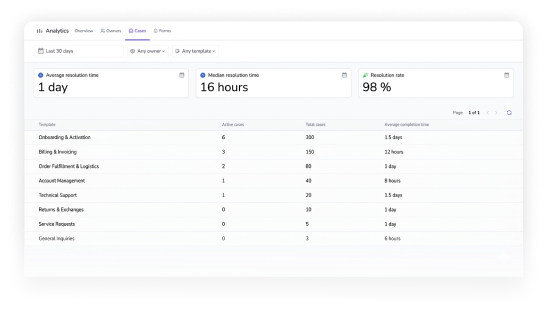
Owners
The Owners tab surfaces per-agent performance so managers can see who is handling the most cases and how quickly. For example, compare resolution times across your team to identify where coaching or workload balancing is needed.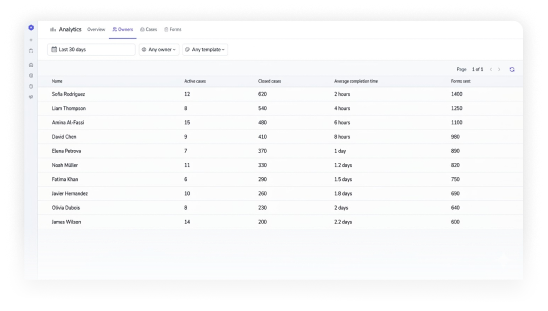
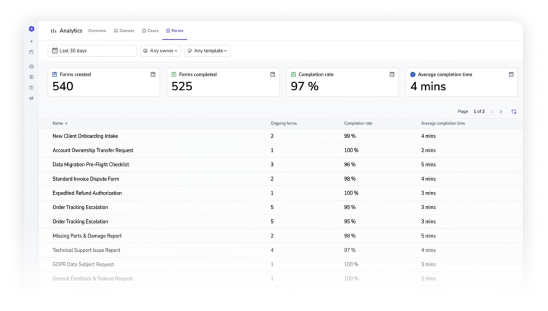
Forms
The Forms tab tracks Smart Checklist engagement: forms created, forms completed, completion rate, and average completion time—broken down per form. For example, identify which checklists have low completion rates and adjust them to remove friction.